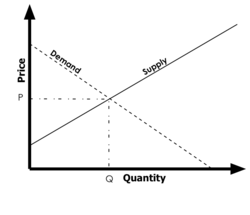
The price at which the demand and the supply of a product are equal is known as equilibrium price.
Equilibrium price assumes that Qs = Qd
where, Qs is quantity supplied and Qd is demand of product. Now, it can be explained with a graph, in which quantity comes on x-axis and price of the product comes on y-axis. The demand curve is downward sloping linear curve and the supply curve is upward sloping linear curve. The points where they cross each other is the equilibrium price.
Please have a look on graph, which shows equilibrium price!
