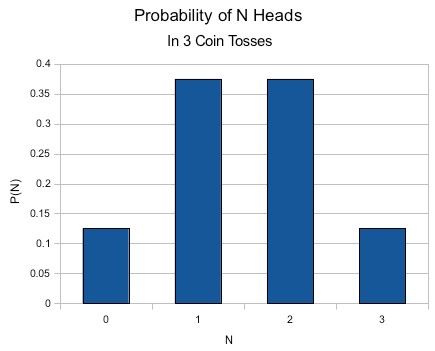
Suppose we want something simple, like the number of heads in 3 tosses of a coin. We list the outcomes and count those of interest. For our coin toss example, know the choices are
t t t - 0 heads
t t h - 1 head
t h t - 1 head
t h h - 2 heads
h t t - 1 head
h t h - 2 heads
h h t - 2 heads
h h h - 3 heads
Because it is easier here, we will create the distribution "sideways". Down the side, we will list the number of heads. Across we will show the probability as a bar indicating the number of instances. At the end of the bar, we will show the probability of that number of heads in 3 tosses.
N | P(N heads in 3 tosses)
0 | x (1/8)
1 | x x x (3/8)
2 | x x x (3/8)
3 | x (1/8)
With a little more effort, one can use the graphing capabilities of spreadsheet software to create a more conventional distribution graph.
