
A graph of a linear equation is a straight line. Generally, the graph is drawn on grid paper, or plain paper, on which you mark some axes and identify the units you are using for the coordinates. The horizontal axis is generally the independent variable (often, x), and the vertical axis is the dependent variable (often, y or F(x)). Points are located by their coordinates.
Once you have plotted two points that satisfy the equation, you can draw a straight line through them and you have plotted the graph of the equation.
The picture provides an illustration. The equation in the picture is in a particular form called "intercept form." In this form, the equation is (x/x-intercept) + (y/y-intercept) = 1. You can see that when x=0, the equation is satisfied by y = y-intercept. Likewise, when y=0, the equation is satisfied by x = x-intercept. This makes graphing the equation pretty easy, as all you must do is locate a point on the x-axis (the x-intercept), and a point on the y-axis (the y-intercept). The line goes through those points.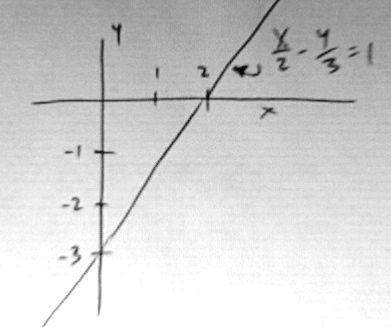