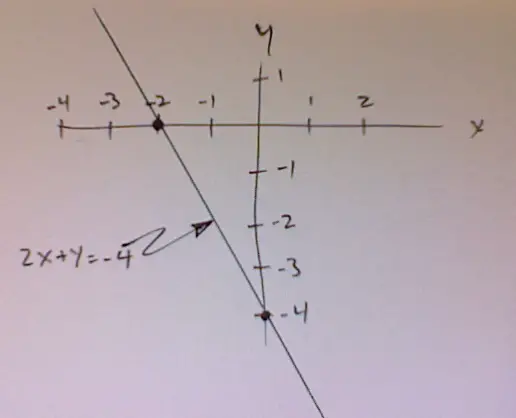
First you find some values for x and y that satisfy the equation. For one like this, it is often useful to look at the intercepts, that is, the places where the graph crosses the x or y axes.
When x =0, the graph will cross the y axis. The value of y at that point will be
2(0) + y = -4, or y = -4
When y =0, the graph will cross the x axis. The value of x at that point will be
2x + (0) = -4, or x = -4/2 = -2.
Now we have 2 points, which are all that are necessary for us to draw the graph of this equation. Take a look at the picture.
