Anonymous

How to calcuate an increment on a graph?

2

2 Answers

Andrew Jorge Profile
Andrew Jorge answered

A simple movement.

like

y = x and y = x + 1

y= x has 0 as its y intercept while teh other one.

if you graph both lines, y = x + 1, is just above y=x line.

You can also calculate it through this ti 83 graphing calculator, to get more graphing calculations.
Oddman Profile
Oddman answered
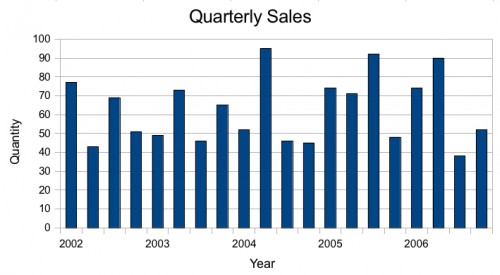
Usually, you want to choose an increment or interval on a graph so there are between 3 and 20 divisions over the range being graphed. Some would say 5-8 intervals would be a better number than 3-20. Usually, people deal with graph scales more easily if the scale interval markers are multiples of 1, 2, 5, or 10.  Example   You want to graph data that ranges from 38 to 95 over a period of 5 years. You have data for every quarter (year) over that time. It is important to you that the graph show the relative size of the quantities being graphed.   The latter requirement means the low end of the vertical scale will be 0 (not 30 or 35 or 38). The upper end of the scale can be 95 or 100, giving 19 or 20 intervals of width 5. I would probably use an interval of 10 for the major divisions. This would give 10 major intervals, which might be a little cluttered, but is probably acceptable. Adding unmarked lines for the minor intervals of 5 might work if they are not so close together as to be useless.   Likewise, the 20 horizontal intervals (4 quarters per year for 5 years) can tend to clutter the graph in the horizontal direction. You may want to choose a fewer number, or just number every fourth one. The graph here is one way to do it.
If you use a graphing program, as was done here, it may have an "automatic" setting that will choose the intervals for you.

Answer Question

Anonymous