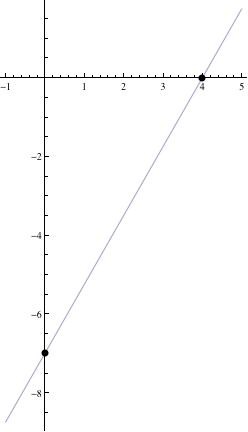
You graph it the way you graph any equation. You find some values of (x, y) that satisfy the equation, plot them, and draw an appropriate curve (line) through them.
I find it convenient to put these equations into intercept form. You do that by dividing by the constant (after putting the equation in standard form). Then, you express the x and y coefficients as denominators.
7x - 4y = 28 (your equation in standard form)
7x/28 - 4y/28 = 1 (divide by the constant 28)
x/4 + y/-7 = 1 (now, we have it in intercept form)
This tells us that two points are
(4, 0) and (0, -7)
We can plot these, draw the line, and we have our graph.
